Dashboard
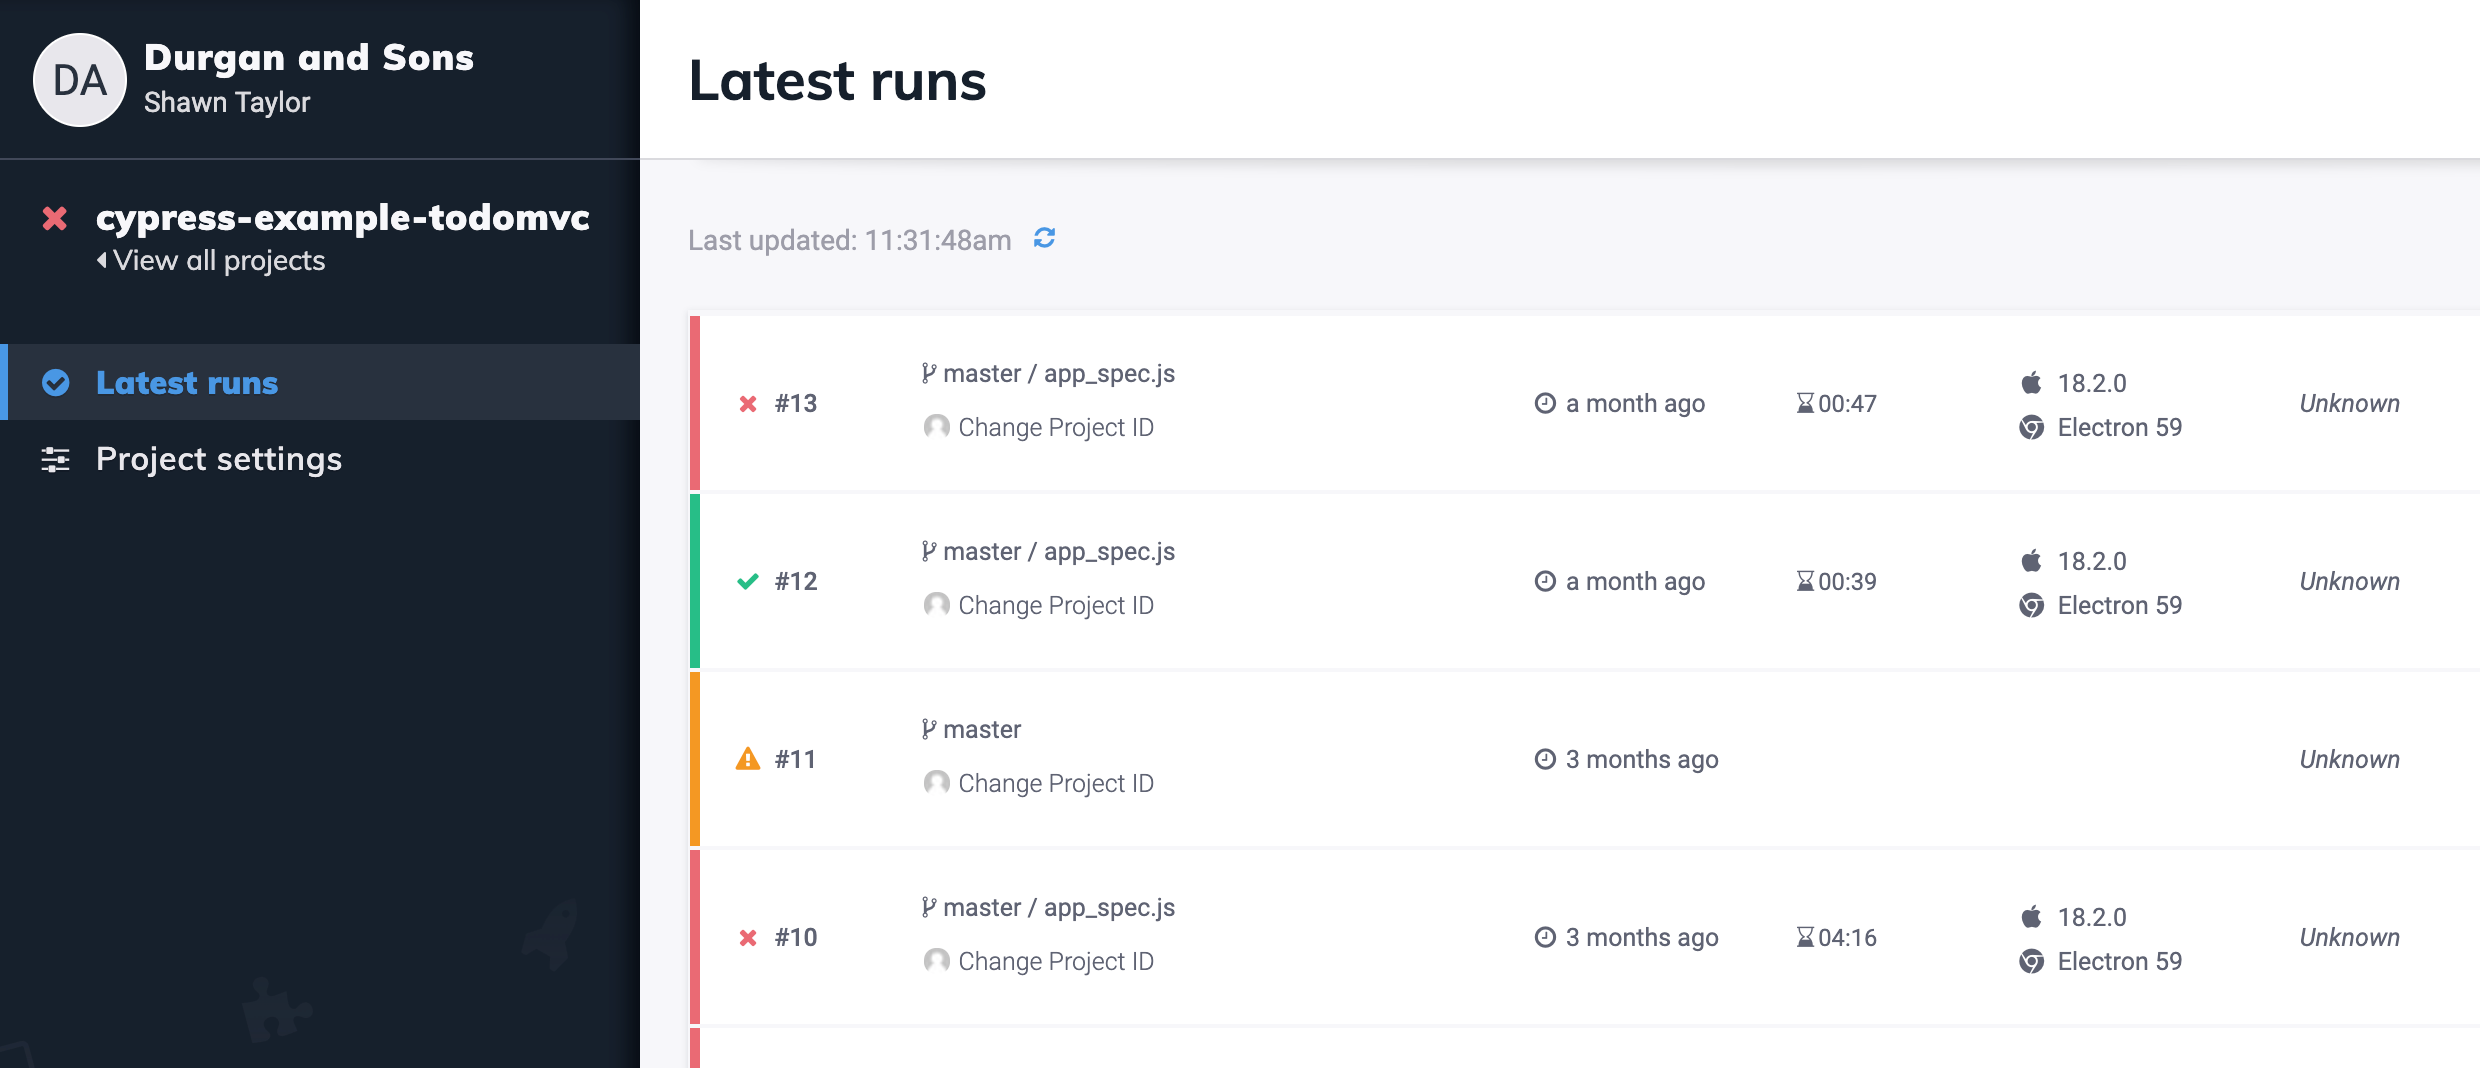
The Cypress Dashboard is a service that gives you access to recorded test results - typically when running Cypress tests from your CI provider. The Dashboard provides you insight into what happened when your tests ran.
Real World Example New
The Cypress Real World App (RWA) leverages the Cypress Dashboard in CI to test over 300 test cases in parallel across 25 machines, multiple browsers, multiple device sizes, and multiple operating systems.
Check out the Real World App Dashboard.
Features
Organize projects
From the Dashboard you can:
- Set up a project to record in the Dashboard
- Reset or add more record keys
- Change who can access your Cypress project
- Transfer ownership of projects
- Delete projects
See test run results
From the Dashboard you can:
- See the number of failed, passing, pending and skipped tests.
- Get the entire stack trace of failed tests.
- View screenshots taken when tests fail or when using
cy.screenshot(). - Watch a video of your entire test run or a video clip at the point of test failure.
- See how fast your spec files ran within CI including whether they were run in parallel.
- See related groupings of tests.

Manage runs
From the Dashboard you can:
- Cancel runs currently in progress
- Archive runs in a canceled or errored state
Manage organizations
From the Dashboard you can:
- Create, edit and delete organizations
- See usage details for each organization.
- Pay for your selected billing plan.
Manage users
From the Dashboard you can:
- Invite and edit user's roles for organizations
- Accept or reject requests to join your organization.
Integrate with GitHub
From the Dashboard you can:
- Integrate your Cypress tests with your GitHub workflow via commit status checks
- Integrate Cypress into GitHub via pull requests
Integrate with Slack
From the Dashboard you can:
- Integrate Cypress into Slack on every recorded test run.
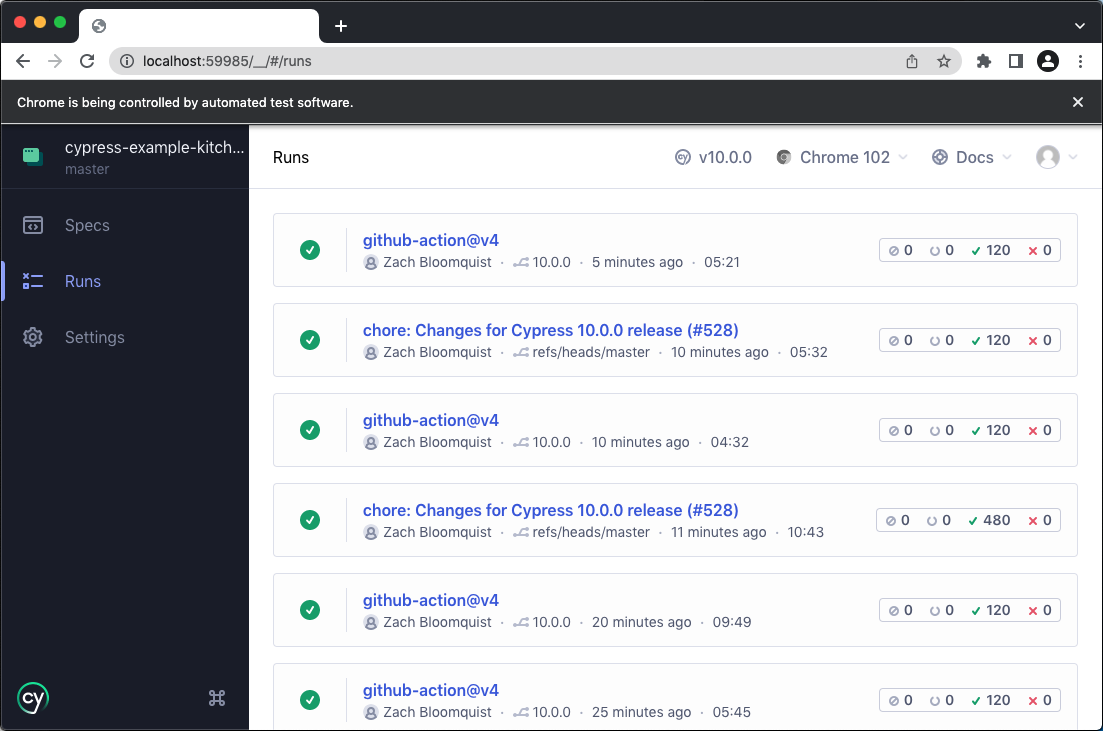
See test runs in the Cypress Project Runs
Additionally we've integrated the latest test run info into Cypress. This means you can see the status of your tests in the Runs tab from within each project.

Have a question you don't see answered here?
We have answered some common questions about the Dashboard Service in our FAQ.
Example projects
Once you log in to the Dashboard Service you can view any public project.
Here are some of our own public projects you can view: